
41
Modeling energy savings is notoriously
difficult, the issues are far more complicated
when we try to predict energy and costs more
than a decade into the future. In this study,
we perform a simplified analysis to get an
indication of the issues.
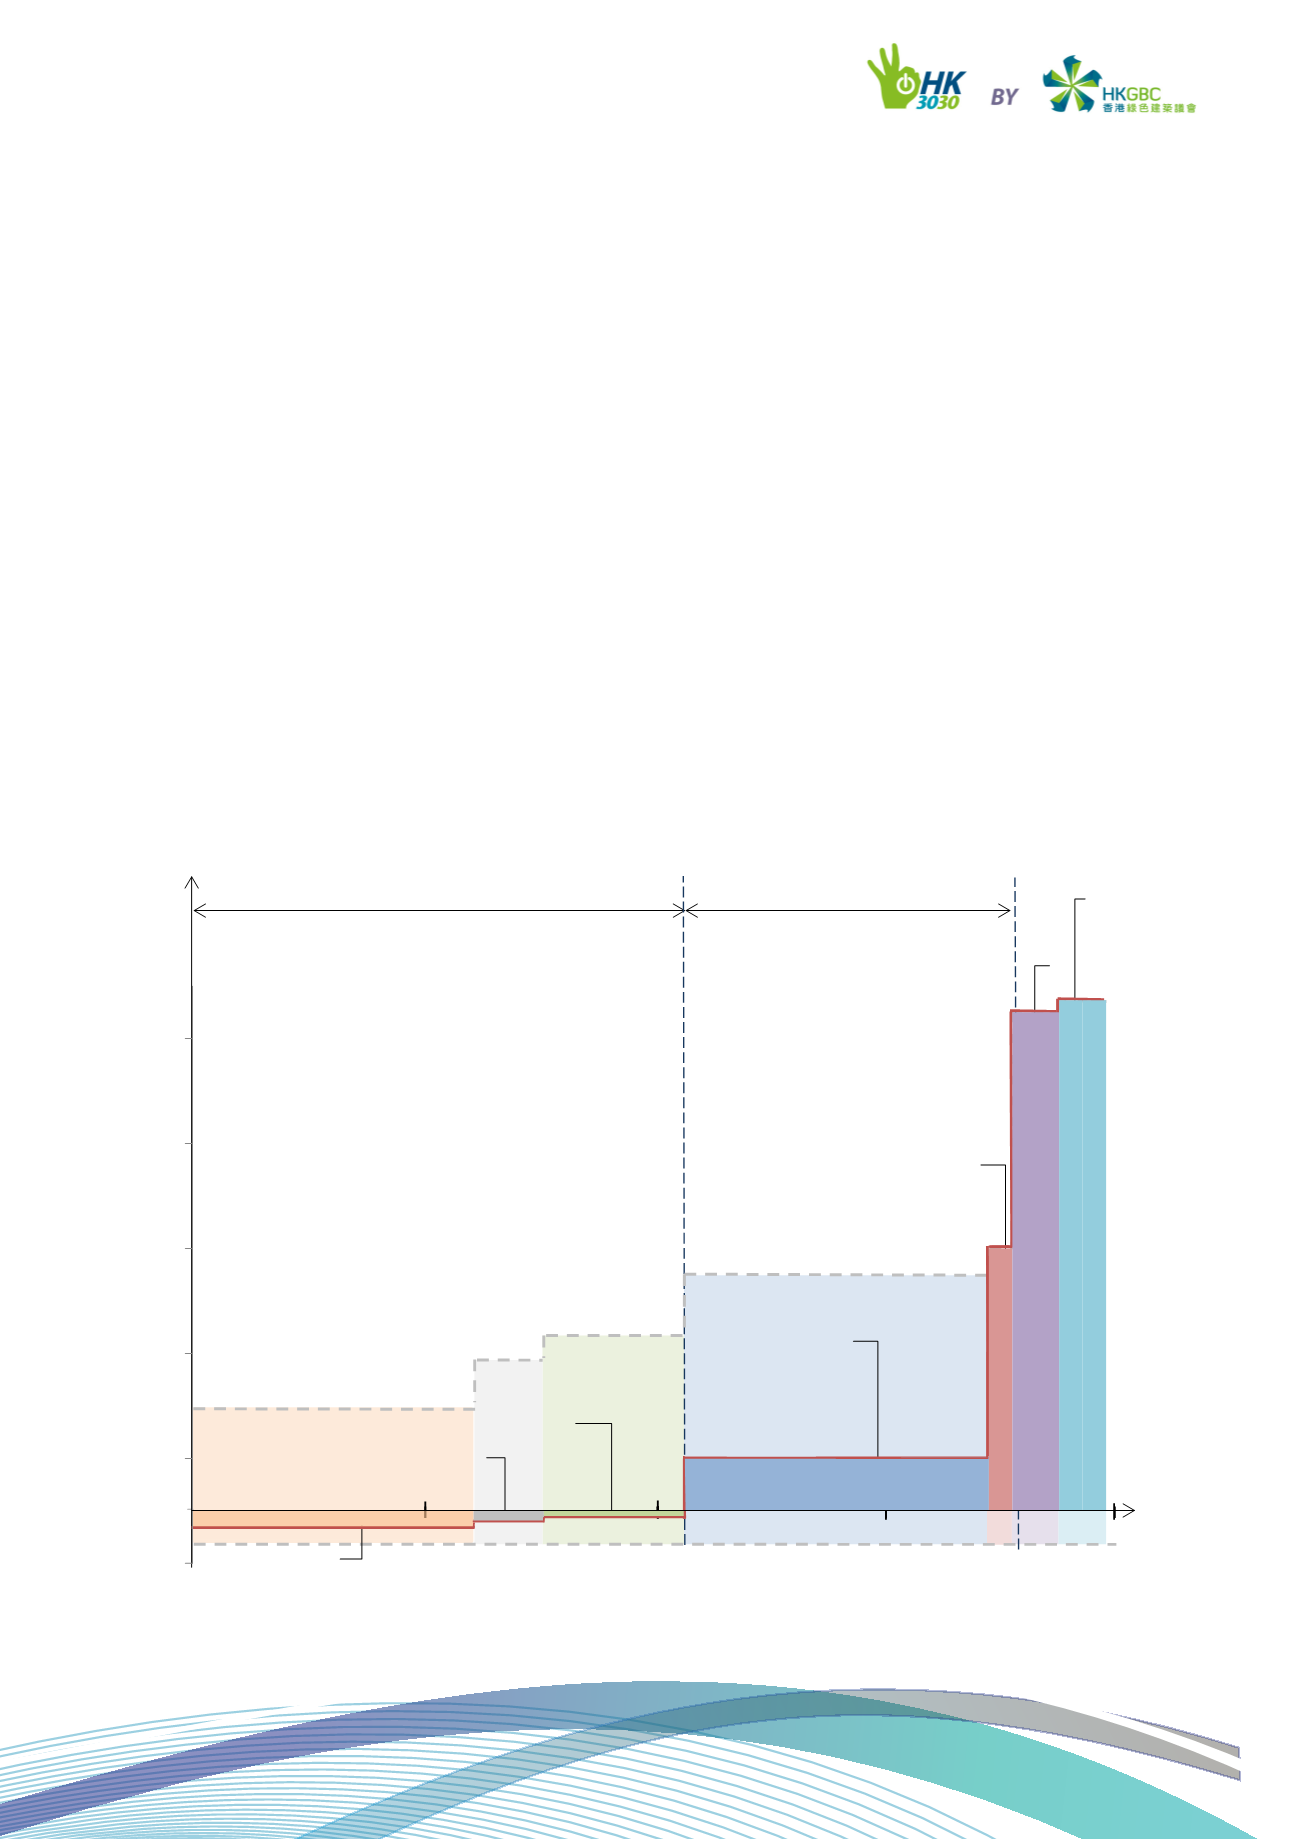
We start by considering the scenario laid
out in the EB roadmap, and imagine that it
is now 2030: the benchmarking tool (see
section on benchmarking) is fully launched
and covers a wide range of buildings; the
BEC and EAC now require all buildings to
be continuously retro-commissioned such
that they are operated at their optimum
performance. However, due to inherent
inefficiencies of out-dated systems, some
buildings are unable to meet the minimum
benchmark required by building regulations,
these buildings are then encouraged (or
forced) to retrofit their systems. For example,
buildings that are 35% less efficient than the
code minimum will undergo retrofits.
0
Chiller
Lift and escalator
HVAC – Air-distribution system
Typical retrofit scenario
Facade
Renewable
energy
Scenario target:
35%
20%
Lighting
Cost Abatement over 5 years [$/kWh]
40%
30%
Financed by loans and ESCOs: Currently cost-effective measures
[70% of the required reduction for scenario target]
Payback within 5 years
Measures that require additional drivers
through tax, rebates, carbon credit-trading
[30% of the required reduction]
Minimum cost scenario
HVAC – Water-distribution system
Maximum cost scenario
Cost abatement curve for
retrofitting existing buildings
10%
Cost abatement over 5 years [HKD/k h]
-10
10
30
50
70
90
Energy reduction as a percentage of
CBSI consumption
Cost abatement over 5 years [HK$/kWh]


